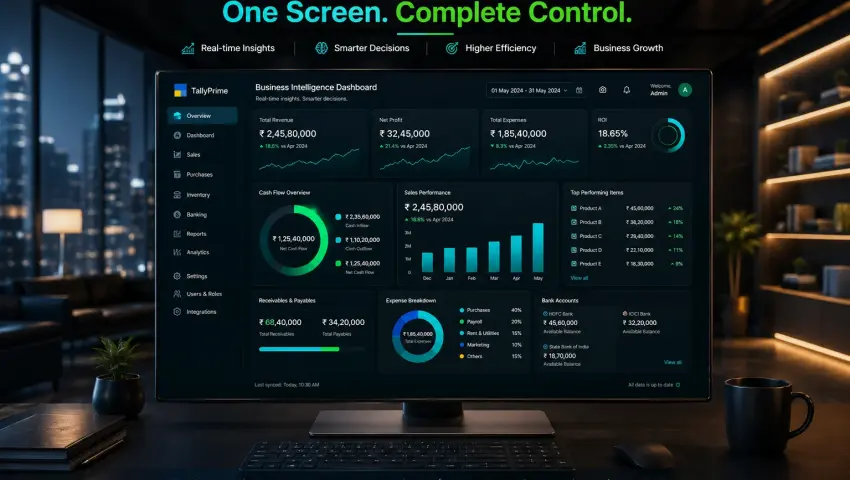
Managing multiple software is over. Sales, purchases, accounting, inventory, CRM activities, and operational data are displayed live on one AI dashboard. This provides better visibility and eliminates scattered reports.
All Business Data in One Central Dashboard: One Screen. Complete Control.
Stop running your business on scattered Excel sheets and delayed reports. Connect Tally, your CRM, E-commerce stores, and Marketing platforms into a single, real-time command center.
The Hidden Cost of Scattered Data: Data Rich, but Information Poor
Today’s business owner is trapped in a paradox: plenty of data, but zero clarity. Your accounts are in Tally, sales in Zoho, orders on Shopify, and marketing spend in Google Ads.
🛑 Disconnected systems create chaos:
You don't know your exact, real-time daily net profit.
Your cash flow reality is hidden behind delayed reports.
You only discover losses at the end of the month when it's too late.
This is an architecture problem. Pragyantra’s Centralized Business Dashboard puts an end to this chaos by building your digital command center.
1. What is a Central Business Dashboard? (The True CEO View)
Your CA needs a balance sheet; you need a decision board. Our BI ecosystem pull raw data using APIs, cleanses it, and translates it into actionable visual metrics.
❌ The Old Way
🚫 4 different software logins
🚫 3 days waiting for accountant
🚫 2 broken Excel consolidations
🚫 1 stressed decision-maker
✅ The Dashboard Way
⭐ Today's Net Profit (Real-Time)
⭐ Live Cash Flow & Receivables
⭐ Sales vs. Target Tracking
⭐ Product-Wise Gross Margins
💡 This is not an accounting screen. This is the Management Screen.
2. The 5 Operational Crises We Eliminate
Without a unified dashboard, your business leaks money through operational blindness. Here is exactly what Pragyantra automates away:
👤 The Accountant Dependency
Stop calling your finance team or CA for every minor operational report. Access live data dynamically and run your business without constant gatekeepers or waiting loops.
⏳ Delayed Decision-Making
Stop finding out about product margin leaks or operational losses at month-end. React to volatile raw material shifts or market demands daily.
👁️ Cash Flow Blindness
Instantly see exactly how much liquid capital is stuck in the market. Automatically flag specific clients who haven't cleared outstanding invoices in over 90 days.
📊 Manual Excel Risks
Eliminate duplicate data entries, broken spreadsheet formulas, and manual copy-paste human errors that fundamentally distort your true financial reality.
🔄 The Sales vs. Reality Gap
Bridge the reconciliation nightmare between what your active CRM claims as "Deals Won" vs. what your Tally ledger actually logs as "Invoiced & Settled."
3. Complete Connectivity: Systems We Integrate
Pragyantra’s core strength lies in custom API architecture. If your operational workflows are digital, we can map them straight to your centralized hub.
Zoho CRM, Salesforce Cloud frameworks, HubSpot, and LeadSquared platforms.
🛒 Storefronts & E-Commerce
Amazon Seller Central, Flipkart Marketplace, Shopify engines, and WooCommerce channels.
📈 Marketing & Performance Sync
Google Ads Manager, Facebook (Meta) Ads Transparency networks, and Google Analytics 4 tracking strings.
📁 Legacy & Spreadsheet Data
Cloud-hosted Google Sheets, local secure Excel Workbooks, and raw tabular CSV files.
4. Core Features of the Pragyantra Dashboard
⚡ 100% Automated Real-Time Sync
The exact millisecond a new invoice voucher is passed in TallyPrime, a high-value deal is committed inside Zoho CRM, or a cart checkout completes on Shopify, your dashboard updates without manual page refreshes.
🎯 Custom KPIs & Smart Widgets
We bypass rigid, templated layouts. We code bespoke metrics specific to your industry matrix. Want to track your top 5 high-velocity products side-by-side with lowest stock alerts? We map it exactly how you want to read it.
📱 Multi-Device, On-the-Go Access
Your operations move with you. Check critical daily performance markers during a flight via smartphone layout, audit inventory margins on the production floor via tablet, or cast live metrics during quarterly board reviews.
🔐 Granular Role-Based Access Control (RBAC)
You control data accessibility narratives safely. Your sales frontline only monitors local target widgets, HR audits attendance, and the Accounts division tracks payables—while you maintain the absolute financial overview master key.
5. The ROI Breakdown: Fragmented vs. Centralized Command
Business Metric
Fragmented Software (Manual)
Pragyantra Central Dashboard
Report Generation Time
3 to 4 Restless Days
Instantaneous (Real-Time)
Data Accuracy
Prone to human entry & formula errors
100% Automated System Integrity
Outstanding Tracking
Delayed month-end compilation loops
Daily Proactive Live Alerts
Decision Velocity
Reactive (End-of-month surprises)
Proactive, Fast & Confident
2. The 5 Operational Crises We Eliminate
Without a unified dashboard, your business leaks money through operational blindness. Here is exactly what Pragyantra automates away:
👤 The Accountant Dependency
Stop calling your finance team or CA for every minor operational report. Access live data dynamically and run your business without constant gatekeepers or waiting loops.
⏳ Delayed Decision-Making
Stop finding out about product margin leaks or operational losses at month-end. React to volatile raw material shifts or market demands daily.
👁️ Cash Flow Blindness
Instantly see exactly how much liquid capital is stuck in the market. Automatically flag specific clients who haven't cleared outstanding invoices in over 90 days.
📊 Manual Excel Risks
Eliminate duplicate data entries, broken spreadsheet formulas, and manual copy-paste human errors that fundamentally distort your true financial reality.
🔄 The Sales vs. Reality Gap
Bridge the reconciliation nightmare between what your active CRM claims as "Deals Won" vs. what your Tally ledger actually logs as "Invoiced & Settled."
3. Complete Connectivity: Systems We Integrate
Pragyantra’s core strength lies in custom API architecture. If your operational workflows are digital, we can map them straight to your centralized hub.
Zoho CRM, Salesforce Cloud frameworks, HubSpot, and LeadSquared platforms.
🛒 Storefronts & E-Commerce
Amazon Seller Central, Flipkart Marketplace, Shopify engines, and WooCommerce channels.
📈 Marketing & Performance Sync
Google Ads Manager, Facebook (Meta) Ads Transparency networks, and Google Analytics 4 tracking strings.
📁 Legacy & Spreadsheet Data
Cloud-hosted Google Sheets, local secure Excel Workbooks, and raw tabular CSV files.
4. Core Features of the Pragyantra Dashboard
⚡ 100% Automated Real-Time Sync
The exact millisecond a new invoice voucher is passed in TallyPrime, a high-value deal is committed inside Zoho CRM, or a cart checkout completes on Shopify, your dashboard updates without manual page refreshes.
🎯 Custom KPIs & Smart Widgets
We bypass rigid, templated layouts. We code bespoke metrics specific to your industry matrix. Want to track your top 5 high-velocity products side-by-side with lowest stock alerts? We map it exactly how you want to read it.
📱 Multi-Device, On-the-Go Access
Your operations move with you. Check critical daily performance markers during a flight via smartphone layout, audit inventory margins on the production floor via tablet, or cast live metrics during quarterly board reviews.
🔐 Granular Role-Based Access Control (RBAC)
You control data accessibility narratives safely. Your sales frontline only monitors local target widgets, HR audits attendance, and the Accounts division tracks payables—while you maintain the absolute financial overview master key.
5. The ROI Breakdown: Fragmented vs. Centralized Command
Financial data is the lifeblood of your enterprise. Our highly isolated backend middleware infrastructure ensures it remains utterly secure, scalable, and resilient:
📥
1. Extraction
Secure pulls via protected REST/SOAP APIs.
⚙️
2. Transformation
Duplicates purged, schemas aligned cleanly.
📦
3. Storage
Encrypted redundant nodes on AWS/Azure.
📊
4. Visualization
Actionable charts mapped via custom UI.
🛡️ Security Standards: We enforce 256-bit AES encryption, Multi-Factor Authentication (MFA), and strict systemic audit logs. Even if your physical local office server crashes unexpectedly, your visual command center and accounting history remain 100% safe, operational, and accessible in the cloud.
7. Our 4-Step Implementation Journey
We build and wire your custom corporate dashboard command center smoothly without causing a single minute of interruption to your ongoing daily invoicing:
📋 Step 1: Discovery
Detailed audit of your software environments, data health, and exact industry-specific KPI mapping parameters.
🔀 Step 2: API Mapping
Building the secure token bridges and configuring calculation data logic constraints between fragmented databases.
Executing rigorous cross-verifications against past ledger balances, training management staff, and triggering live sync pipelines (Completed within 2-4 weeks).
⏱️ The Pragyantra "Quick-Win" Phased Rollout Promise
We bypass extended waiting times. You start harvesting analytical ROI from day two through structural phase releases:
Within 48 Hours: Your "Core Sales & Liquid Cash Flow" tracking boards launch live.
Within 14 Days: Deep structural CRM workflows and Multi-warehouse Inventory mapping stabilize.
Within 21 Days: Full cross-platform Marketing ROI BI ecosystem sync deployment completes.
🌍 Multi-Currency & Multi-Branch Consolidation
Expanding your active market footprints to the UAE, US, or Singapore? Managing real-time foreign exchange conversions and consolidated profit parameters across distributed cross-border channels is a massive compliance hurdle in offline platforms. Our centralized dashboard engine automates this lifecycle—converting multi-currency records (INR, AED, USD) seamlessly into your selected base legal currency in real-time. View your global commercial operations metrics on one single glass screen.
⚖️ Transparent Pricing, Infinite Value
Many traditional BI consultancies lock business budgets into rigid, per-user monthly SaaS subscription models that scale drastically as your team footprint expands. Pragyantra works on transparent rules. We charge a clean, One-Time Architecture & Implementation Fee to configure your dedicated dashboard infrastructure, accompanied by a nominal, flat-rate Annual Maintenance Contract (AMC) for live API monitoring and version support. You maintain 100% data code asset ownership—without paying for added user additions.
Frequently Asked Questions (FAQs)
Q1. Our business operations only utilize Tally right now. Can you compile a dashboard just for that?
Absolutely. A Tally-isolated central dashboard deployment is incredibly robust. We convert your raw transaction lines into fluid, visual charts mapping customer aging balances, sales trends, and immediate stock lifecycles without requiring you to open or navigate the accounting database layout.
Q2. Do I need to be fluent with complex accounting terminology or Tally operations to read this dashboard?
Not at all. The dashboard platform is configured specifically for non-technical business founders, managing directors, and core corporate executives. It filters metrics into simple, visual charts—stripping out confusing accounting journal parameters entirely.
Q3. Can historical offline Excel datasets or archived spreadsheets be integrated into the new dashboard?
Yes, we safely digest and structure your legacy Excel books or past Google Sheets registries. This ensures you can smoothly compare active real-time transaction velocities directly against past annual performance charts.
Q4. Where exactly is my commercial financial data hosted and stored?
Your information clusters are contained inside a heavily isolated, private, and encrypted cloud vault environment. Your company retains 100% absolute ownership and data control rights over your digital storage layers at all times.
🚀 Stop Guessing. Start Knowing.
Businesses cannot scale on gut feelings and delayed summaries. Sustainable market growth demands absolute data clarity. Stop formatting tedious spreadsheets. Start managing predictable enterprise scale.